Diagram Types
The Graphical Views available can provide answers to a variety of pertinent business and workflow-related questions for selected jobs/job groups.
Graphical View diagram types include:
-
PERT Diagram
-
Critical Path Diagram
-
Gantt Chart
-
Double Tree Diagram
-
Status Board
-
Radial Tree
-
Radial Graph
-
Grouping Diagram
PERT Diagram
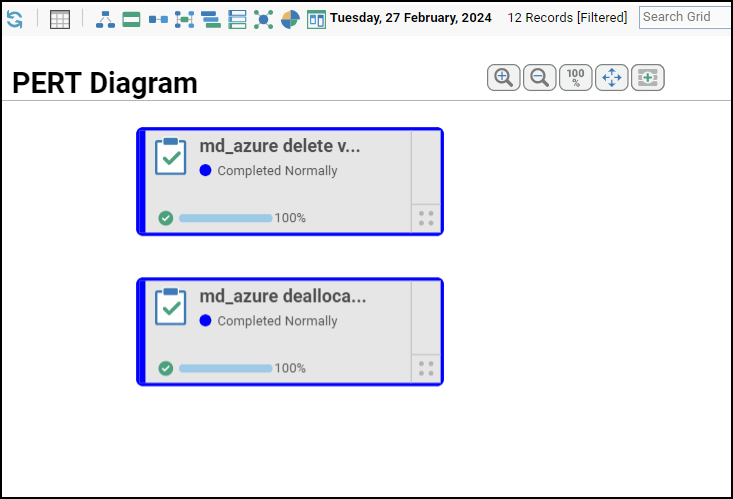
Similar to a Business View diagram, a PERT diagram shows the run sequence from start to end. PERT diagrams are event-based and track the interdependencies between tasks Information is displayed in a left-to-right flow with arrows showing the direction of workflow through the process.
While they show event interrelationships, they do not display time-related information such as jobrun duration length. Select Toggle Direction on the PERT Diagram to change the direction of nodes.
To create a PERT diagram:
-
Highlight an applicable job(s) or a job group in the Job Activity pane.
-
If you select multiple individual jobs, the diagram shows only the jobs selected – not predecessor or successor jobs.
-
If you select a job group, the diagram includes all jobs that have the selected job group as a parent, eliminating the need to manually select individual jobs within the group.
-
-
Right-click to select View PERT Diagram from the menu options.
Other actions that can be performed while viewing PERT Diagram are:
-
Right-click a job or a job group node on the PERT Diagram and choose:
-
Details to display the Job Details dialog.
-
View Critical Path to display the Critical Path Diagram for the selected job occurrences.
-
View Double Tree Diagram – One Level to display the Double Tree Diagram (One Level) for the selected job occurrence.
-
View Double Tree Diagram – All Levels to display the Double Tree Diagram (All Levels) for the selected job occurrences.
-
View Gantt Chart to display the Gantt Chart for the selected job group occurrences.
-
View Status Board to display the Status Board for the selected job group occurrences.
-
View Grouping Diagram to display the Grouping Diagram for the selected job group occurrences.
-
View In Radial Tree to display the Radial Tree Diagram for the selected job or job group occurrences.
-
View In Radial Graph to display the Radial Graph Diagram for the selected job or job group occurrences.
-
Remove From Diagram to remove the selected node from PERT Diagram view. To show the node again, go to the grid view and refresh the grid.
-
Add Predecessors option to view its preceding node.
-
Add Successors option to view its succeeding node.
-
Show Blocking Predecessors option to view all the preceding nodes which the selected node is dependent on.
Example: JobA has 10 predecessors. All 10 of those jobs must run before JobA can run. If at a given point in time, five of those predecessors have run, and five have not, only the five that haven't run are "Blocking Predecessors". All 10 are predecessors but only those that haven't run will display when you "Show Blocking Predecessors" for JobA.
-
Add Job Parent to add the parent of the selected job or job group node.
-
Insert Job into Schedule to insert an unscheduled job into the schedule. This option is only applicable if the job or job group’s definition has the Unscheduled Allowed option set.
-
Remove Job(s) from Schedule to remove selected job occurrence from the schedule, for any date. If a job group occurrence is selected, all of the group’s child jobs are removed.
-
Add Job Group Children option to add child jobs that are part of the selected job group in the view.
-
-
Right-click anywhere on the PERT Diagram and choose one of these options from the context menu:
-
Add JobRun – Displays the Job Search dialog used to search and add resulting jobrun(s) to the PERT Diagram.
To search for a jobrun you want to add to the PERT Diagram, specify a value in one or more fields and click Search.
Job No. – The job number.
Name – The job name.
Owner – The owner of the job instance.
Runtime User – The runtime user for the job instance.
Agent – The agent/adapter associated with the job.
Type – Whether it is a job or job group.
Status – Whether the job is enabled or disabled.
Click Show Advanced to display these fields:
Command – The command specified in the job definition.
Agent List – The agent list associated with the job.
Parent Group – The parent job group for the job.
Class – The job class.
Operator Release – Whether the operator release is required or not required.
Unscheduled – Whether the unscheduled job is allowed or not allowed.
-
The Search Results section lists the job instance records resulting from the search.Select one or more records and click Add. The selected jobruns are added to the PERT Diagram.
Statistics – Displays the Job Statistics dialog that shows job occurrence statistics for the day currently displayed in the Job Activity pane. You can view statistics for All Jobs, Production jobs, and Unscheduled jobs on the respective tab. For more information about Job Statistics, see Job Statistics Dialog.
Print – Prints the PERT Diagram.
Refresh – Refreshes the PERT Diagram.
-
In a PERT Diagram:
-
The node of a critical jobrun is marked with a red “Critical” label.
-
The node of a jobrun that is on the critical path of another job is marked with a red “On Critical Path” label.
-
The node of a jobrun that is critical and on the critical path of another job is marked with red “Critical” and “On Critical Path” labels.
-
The link between a jobrun node and its non-job dependency is shown in red, if the dependency has not been met.
Critical Path Diagram
The Critical Path diagram is much like the PERT diagram with a distinct difference – it shows the jobruns that are important for selected job/job group to run successfully. Information shown in the Critical Path diagram is time critical; jobs identified as most critical are those that have the longest run time of all jobs in the diagram.
In instances where jobs are taking longer than anticipated, information such as Estimated Duration and Actual Duration are adjusted accordingly. This information is available by placing the cursor on the jobrun selection.
Select Toggle Direction on the Critical Path Diagram to change the direction of nodes.
To create a Critical Path diagram:
-
Click on a job or a job group in the Job Activity pane.
-
Click the Critical Path icon in the main menu or right click to select View Critical Path from the menu options.
Other actions that can be performed while viewing Critical Path Diagram are:
-
Right-click a job or a job group node on the Critical Path and select:
-
Details to display the Job Details dialog.
-
View PERT Diagram to display the PERT Diagram for the selected job occurrences.
-
View Double Tree Diagram – One Level to display the Double Tree Diagram (One Level) for the selected job occurrence.
-
View Double Tree Diagram – Levels to display the Double Tree Diagram (All Levels) for the selected job occurrences.
-
View Gantt Chart to display the Gantt Chart for the selected job group occurrences.
-
View Status Board to display the Status Board for the selected job group occurrences.
-
View Grouping Diagram to display the Grouping Diagram for the selected job group occurrences.
-
View In Radial Tree to display the Radial Tree Diagram for the selected job or job group occurrences.
-
View In Radial Graph to display the Radial Graph Diagram for the selected job or job group occurrences.
-
Remove From Diagram option to remove the selected node from the Critical Path view. To show the node again, go to the grid view and refresh the grid.
-
Add Predecessors option to view its preceding node.
-
Add Successors option to view its succeeding node.
-
Show Blocking Predecessors option to view all the preceding nodes which the selected node is dependent on.
Example: JobA has 10 predecessors. All 10 of those jobs must run before JobA can run. If at a given point in time, five of those predecessors have run, and five have not, only the five that haven't run are "Blocking Predecessors". All 10 are predecessors but only those that haven’t run will display when you select "Show Blocking Predecessors" for JobA.
-
Add Job Parent to add the parent of the selected job or job group node.
-
Insert Job into Schedule to insert an unscheduled job into the schedule. (his option is only applicable if the job or job group’s definition has the Unscheduled Allowed option set.
-
Remove Job(s) from Schedule to remove selected job occurrence from the schedule, for any date. If a job group occurrence is selected, all of the group’s child jobs are removed.
-
Add Job Group Children option to add child jobs that are part of the selected job group in the view.
-
Right-click anywhere on the Critical Path Diagram and select one of these options from the context menu:
Statistics – Displays the Job Statistics dialog that shows statistics for job occurrences for the day currently displayed in the Job Activity pane. You can view statistics for All Jobs, Production jobs, and Unscheduled jobs on the respective tab. For more information about Job Statistics, see Job Statistics Dialog.
Print – Prints the Critical Path Diagram.
Refresh – Refreshes the Critical Path Diagram.
In a Critical Path Diagram:
-
The node of a critical jobrun is marked with a red “Critical” label
-
The node of a jobrun that is on the critical path of another job is marked with a red “On Critical Path” label
-
The node of a jobrun that is critical and on the critical path of another job is marked with red “Critical” and “On Critical Path” labels
-
The link between a jobrun node and its non-job dependency is shown in red, if the dependency has not been met:
-
Double Tree Diagram
The Double Tree diagram is based on the idea of displaying jobs that run before and run after a jobrun you select, resulting in a “tree” on either side of the chosen jobrun.
Information in this diagram type can be presented in two ways:
-
One degree – The diagram created shows a single level of predecessors and successors (i.e., parent and child(ren) only).
-
All degrees – This diagram type displays all predecessors and successors for the selected jobrun.
Note: In the above diagram, job 000 Double Tree 2… is the subject of the diagram. It is awaiting the completion of the active job on the lower left side of the tree. To the right are three jobs (job 000 Double Tree 3…) that are waiting for completion of job 000 Double Tree 2…
Select Toggle Direction on the Double Tree Diagram to change the direction of nodes.
To create a Double Tree diagram:
-
Highlight an applicable job(s) or a job group in the Job Activity pane.
-
Click the View Double Tree icon in the main menu or right click to select View Double Tree diagram from the menu options. Choose one of the options: One Degree or All Degrees to generate your selection.
Note: When the icon is selected from the main menu, the default display is All Degrees.
Other actions that can be performed while viewing Double Tree Diagram are:
Right-click a job or a job group node on the Double Tree Diagram (One Level or All Levels) and choose:
-
Details to display the Job Details dialog.
-
View Critical Path to display the Critical Path for the selected job occurrences.
View Double Tree – One Level to display the Double Tree Diagram (One Level) for the selected job occurrences.
View Double Tree – All Levels to display the Double Tree Diagram (All Levels) for the selected job occurrences.
-
View Gantt Chart to display the Gantt Chart for the selected job group occurrences.
-
View Status Board to display the Status Board for the selected job group occurrences.
-
View Grouping Diagram to display the Grouping Diagram for the selected job group occurrences.
-
View In Radial Tree to display the Radial Tree Diagram for the selected job or job group occurrences.
-
View In Radial Graph to display the Radial Graph Diagram for the selected job or job group occurrences.
-
Remove From Diagram option to remove the selected node from the Double Tree Diagram view. To show the node again, go to the grid view and refresh the grid.
-
Insert Job into Schedule to insert an unscheduled job into the schedule. This option is only applicable if the job or job group’s definition has the Unscheduled Allowed option set.
-
Remove Job(s) from Schedule to remove selected job occurrence from the schedule, for any date. If a job group occurrence is selected, all of the group’s child jobs are removed.
Right-click anywhere on the Double Tree Diagram and select one of these options from the context menu:
Statistics – Displays the Job Statistics dialog that shows statistics for job occurrences for the day currently displayed in the Job Activity pane. You can view statistics for All Jobs, Production jobs, and Unscheduled jobs on the respective tab. For more information about Job Statistics, see Job Statistics Dialog.
Print – Prints the Double Tree Diagram.
Refresh – Refreshes the Double Tree Diagram.
-
In a Double Tree Diagram:
-
The node of a critical jobrun is marked with a red “Critical” label
-
The node of a jobrun that is on the critical path of another job is marked with a red “On Critical Path” label
-
The node of a jobrun that is critical and on the critical path of another job is marked with red “Critical” and “On Critical Path” labels.
Gantt Chart
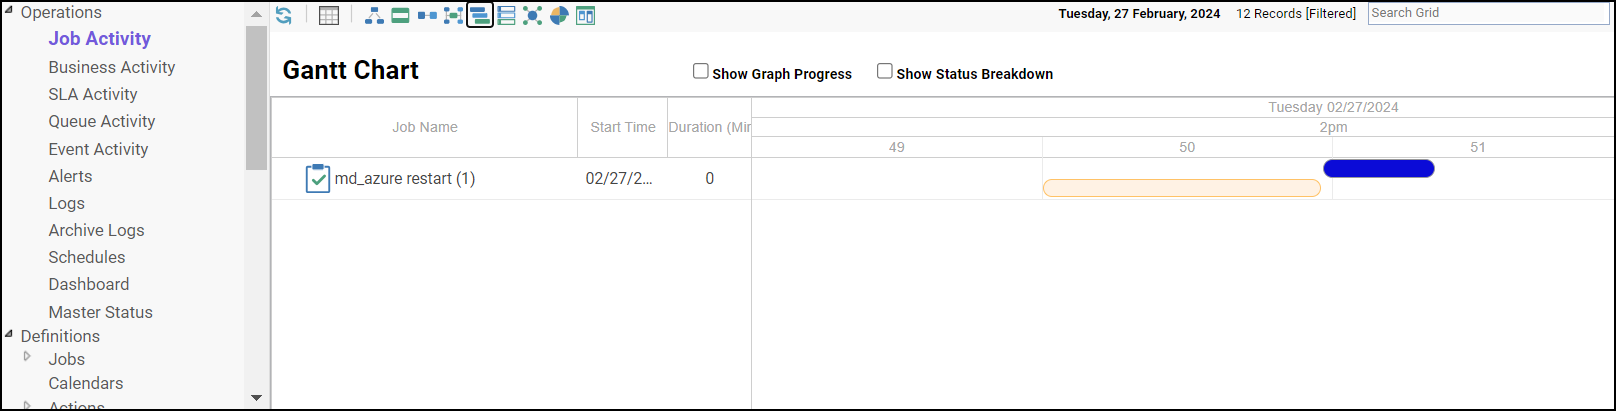
The Gantt Chart shows a timeline by displaying the estimated duration and the actual duration of the selected jobruns.
The Gantt Chart diagram content is generated in one of these ways:
-
If you select multiple jobruns from the Job Activity pane, the diagram is generated from those selections. Only the selected jobruns are included and any predecessors/successors of selected jobruns are excluded.
-
If you select a single jobrungroup in the Job Activity pane, the diagram is generated to include all of the jobruns in that group.
The Gantt Chart diagram contains two panes:
-
A left pane with a grid showing the Job Name, Start Time, and the Duration (in Minutes).
-
A right pane with columns spanning time from the start of the first job to the end of the last job. The job duration is represented by horizontal bars. The width of the bars approximates the estimated duration and actual duration of the job.
Start and end times, as well as the duration may be actual values if the job has completed or expected values if the job is yet to complete. The light colored nodes beneath the actual job timeline represents the baseline which is the estimated start time or end time or duration for each job. In the above image, the green bar represents the actual job timeline whereas the pale orange bar represents the estimated job timeline. Because of rounding and varying display panel sizes, the bars may not precisely represent the duration.
Note: If current time falls within the timeline, a Now flag appears to show current time relative to the timeline.
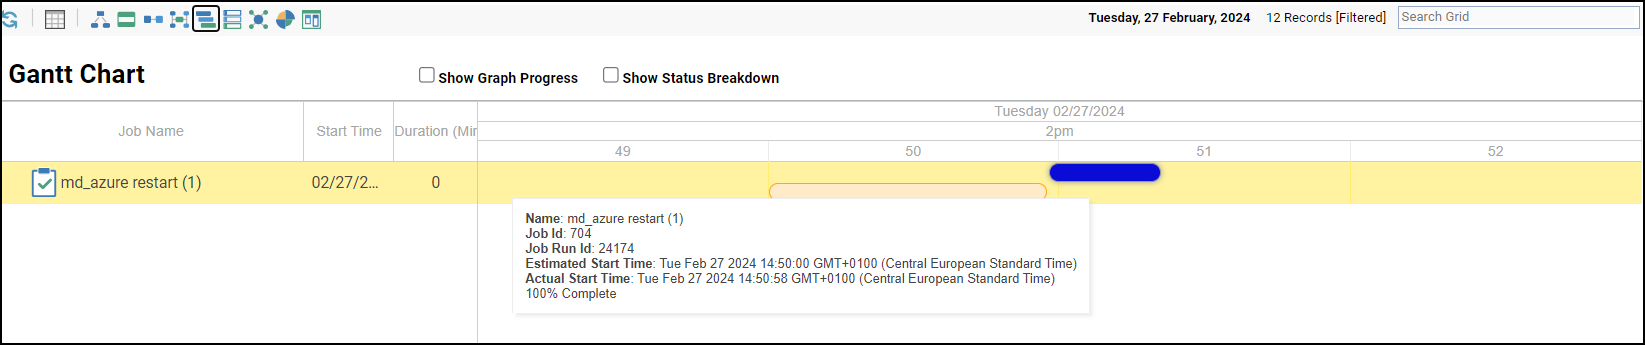
To display the jobrun details such as the Estimated Start Time, Actual Start Time, and so on, hover over the horizontal bar.
Note: In order to preserve the integrity of the time-sensitive information displayed, zooming in or out is not allowed.
Note: The Gantt Chart diagram is also applicable to Business Activity and SLA Activity. The functionality and appearance of the diagram are same as Job Activity.
These two options appear near the top of the Gantt Chart diagram:
-
Show Graph Progress – Displays a line graph overlay on top of the existing diagram so that you can see a comparison between estimated and actual duration. Two lines appear to graph the estimated/baseline and actual progress of the jobs. The line color of the actual duration reflects the users chosen color for completed jobs. See the image below where actual jobs are yet to complete.
-
Show Status Breakdown – Displays a pie chart of job statuses shown in the timeline. The number shown on the outside of the pie chart is the unit (in seconds) of the timeline that applies to that section. In the below image, the jobs were waiting on dependencies for 33 seconds.
To create a Gantt Chart diagram:
-
Click the applicable job(s) or a job group in the Job Activity pane.
-
Click the Gantt Chart icon in the main menu or right-click to select View Gantt Chart from the menu options for the selected job group or selected jobs in a group.
Other actions that can be performed while viewing Gantt Chart are:
-
Right-click anywhere on the left pane to display a context menu with the below options and choose:
Details to display the Job Details dialog.
View Critical Path to display the Critical Path for the selected job occurrences.
View Double Tree – One Level to display the Double Tree Diagram (One Level) for the selected job occurrences.
View Double Tree – All Levels to display the Double Tree Diagram (All Levels) for the selected job occurrences.
View In Radial Tree to display the Radial Tree Diagram for the selected job or job group occurrences.
View In Radial Graph to display the Radial Graph Diagram for the selected job or job group occurrences.
-
Right-click anywhere on the right pane to display a context menu with the below options and choose:
Statistics to display the Job Statistics dialog that shows statistics for job occurrences for the day currently displayed in the Job Activity pane. You can view statistics for All Jobs, Production jobs, and Unscheduled jobs on the respective tab. For more information about Job Statistics, see Job Statistics Dialog.
Print to print the Gantt Chart.
Refresh to update the Gantt Chart with latest data.
Status Board
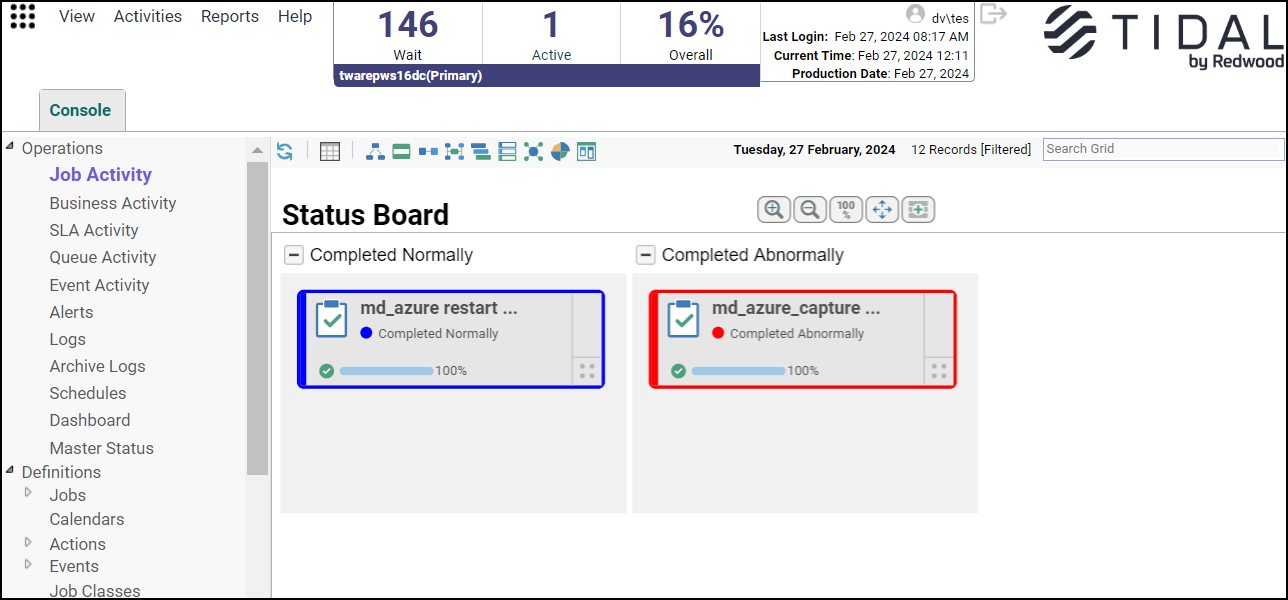
The Status Board displays jobs grouped in columns by jobrun status. The columns included in the board are those of the jobruns displayed. As additional statuses are added for the job, those statuses are automatically displayed.
Status board columns can be toggled hidden or open using the “+” or “-” buttons adjacent to the Status label.
Note: By default, the Status Board displays all states associated with the jobrun. Use the zoom in/zoom out function to automatically fit the diagram to the scale necessary to see all of the content without scrolling.
To create a Status Board:
-
Highlight an applicable job(s) or a job group in the Job Activity pane.
-
Click the Status Board icon in the main menu or right-click to select View Status Board from the menu options for the selected job.
Other actions that can be performed while viewing Status Board are:
-
Right-click a job or a job group node on the Status Board and select:
Details to display the Job Details dialog.
View Critical Path to display the Critical Path for the selected job occurrences.
View Double Tree – One Level to display the Double Tree Diagram (One Level) for the selected job occurrences.
View Double Tree – All Levels to display the Double Tree Diagram (All Levels) for the selected job occurrences.
View Gantt Chart to display the Gantt Chart for the selected job group occurrences.
View Grouping Diagram to display the Grouping Diagram for the selected job group occurrences.
View In Radial Tree to display the Radial Tree Diagram for the selected job or job group occurrences.
View In Radial Graph to display the Radial Graph Diagram for the selected job or job group occurrences.
-
Right-click anywhere on the Status Board and click one of these options from the context menu:
-
Add JobRun – Displays the Job Search dialog used to search and add resulting jobrun(s) to the Status Board.
To search for a jobrun you want to add to the Status Board, specify a value in one or more of these fields and click Search.
-
Job No. – The job number.
-
Name – The job name.
-
Owner – The owner for the job instance.
-
Runtime User – The runtime user for the job instance.
-
Agent – The agent/adapter associated with the job.
-
Type – Whether it is a job or job group.
-
Status – Whether the job is enabled or disabled. Click Show Advanced to display these fields:
-
Command – The command specified in the job definition.
-
Agent List – The agent list associated with the job.
-
Parent Group – The parent job group for the job.
-
Class – The job class.
-
Operator Release – Whether the operator release is required or not required.
-
Unscheduled – Whether the unscheduled job is allowed or not allowed.
-
The Search Results section lists the job instance records resulting from the search.
Select one or more records and click Add. The selected jobruns are added to the Status Board.
-
Statistics – Displays the Job Statistics dialog that shows statistics for job occurrences for the day currently displayed in the Job Activity pane. You can view statistics for All Jobs, Production jobs, and Unscheduled jobs on the respective tab. For more information about Job Statistics, see Job Statistics Dialog.
-
Print – Prints the Status Board.
-
Refresh – Refreshes the Status Board.
In a Status Board:
-
The node of a critical jobrun is marked with a red “Critical” label
-
The node of a jobrun that is on the critical path of another job is marked with a red “On Critical Path” label
-
The node of a jobrun that is critical and on the critical path of another job is marked with red “Critical” and “On Critical Path” labels.
Radial Tree
The Radial Tree diagram displays jobruns radially in a way that their relationships/dependencies are expanded outward.
A radial tree is based on the jobrun being the root of the organizational structure. It appears in the center. To change root node, click on any other jobrun to reorient the diagram with the select jobrun as the root node.
Note: You must select a single jobrun to generate this diagram type.
To generate a Radial Tree diagram:
-
If you select a single jobrun from the Job Activity pane, the diagram will show the predecessors and successors of the selected jobrun radially, with each "ring" in the radial representing a level of association from the selected jobrun.
-
If you select a single JobRun that is a job group, the diagram will be generated to include all of the JobRuns that have the selected JobGroup as a parent.
Note: The layers in the Radial Tree have a fixed, circular width containing a finite amount of space available for the jobrun nodes to be displayed. Jobruns with long names (exceeding 10 characters) are truncated and are identified with an ellipsis. A Radial Tree diagram containing more than 18 jobruns automatically truncates all names and displays an ellipsis to conserve space. Hovering over a Radial Tree element shows details for the jobrun.
Other actions that can be performed while viewing Radial Tree are:
-
Right-click a job or a job group node on the Radial Tree and choose:
-
Details to display the Job Details dialog.
-
View Critical Path to display the Critical Path for the selected job occurrences
-
View Double Tree – One Level to display the Double Tree Diagram (One Level) for the selected job occurrences
-
View Double Tree – All Levels to display the Double Tree Diagram (All Levels) for the selected job occurrences.
-
View In Radial Graph to display the Radial Graph Diagram for the selected job or job group occurrences.
-
Statistics – Displays the Job Statistics dialog that shows statistics for job occurrences for the day currently displayed in the Job Activity pane. You can view statistics for All Jobs, Production jobs, and Unscheduled jobs on the respective tab. For more information about Job Statistics, see Job Statistics Dialog.
-
Print – Prints the Radial Tree Diagram.
-
Refresh – Refreshes the Radial Tree Diagram.
-
Radial Graph
Radial Graph diagrams show jobs runs by status color radially based on the jobrun relationship to jobrun node.
It’s important to understand the role of the “root node” in a radial graph. It is the origination point from which all jobruns originate when the graph is initially displayed. It is displayed as the white circle in the middle of the graph.
By clicking on a jobrun in the diagram, you can reorient the diagram with the selected jobrun as the new root node. The jobrun becomes the new origination point.
To generate a Radial Graph diagram:
-
If you select a single jobrun from the Job Activity pane, the diagram will show the predecessors and successors of the selected jobrun radially, with each "ring" in the radial representing a level of association from the selected jobrun.
-
If you select a single jobrun that is a job group, the diagram will be generated to include all of the JobRuns that have the selected JobGroup as a parent.
Note: The layers in the Radial Graph have a fixed, circular width containing a finite amount of space available for the jobrun nodes to be displayed. Jobruns with long names (exceeding 10 characters) are truncated and are identified with an ellipsis. A Radial Graph diagram containing more than 18 jobruns automatically truncates all names and displays an ellipsis to conserve space. Hovering over a Radial Tree element shows details for the jobrun.
Other actions that can be performed while viewing Radial Graph are:
-
Right-click a job or a job group node on the Radial Graph and choose:
-
Details to display the Job Details dialog.
-
View Critical Path to display the Critical Path for the selected job occurrences.
-
View Double Tree – One Level to display the Double Tree Diagram (One Level) for the selected job occurrences.
-
View Double Tree – All Levels to display the Double Tree Diagram (All Levels) for the selected job occurrences.
-
View In Radial Tree to display the Radial Tree Diagram for the selected job or job group occurrences.
-
-
Right-click anywhere on the Radial Graph Diagram and select one of these options from the context menu:
-
Statistics – Displays the Job Statistics dialog that shows statistics for job occurrences for the day currently displayed in the Job Activity pane. You can view statistics for All Jobs, Production jobs, and Unscheduled jobs on the respective tab. For more information about Job Statistics, see Job Statistics Dialog.
-
Print – Prints the Radial Graph Diagram.
-
Refresh – Refreshes the Radial Graph Diagram.
-
Grouping Diagram
The Grouping Diagram shows jobruns and their association with their parent job group. This diagram is generated from one or more selected job groups and will show the "child" jobs and job groups that belong to the selected groups.
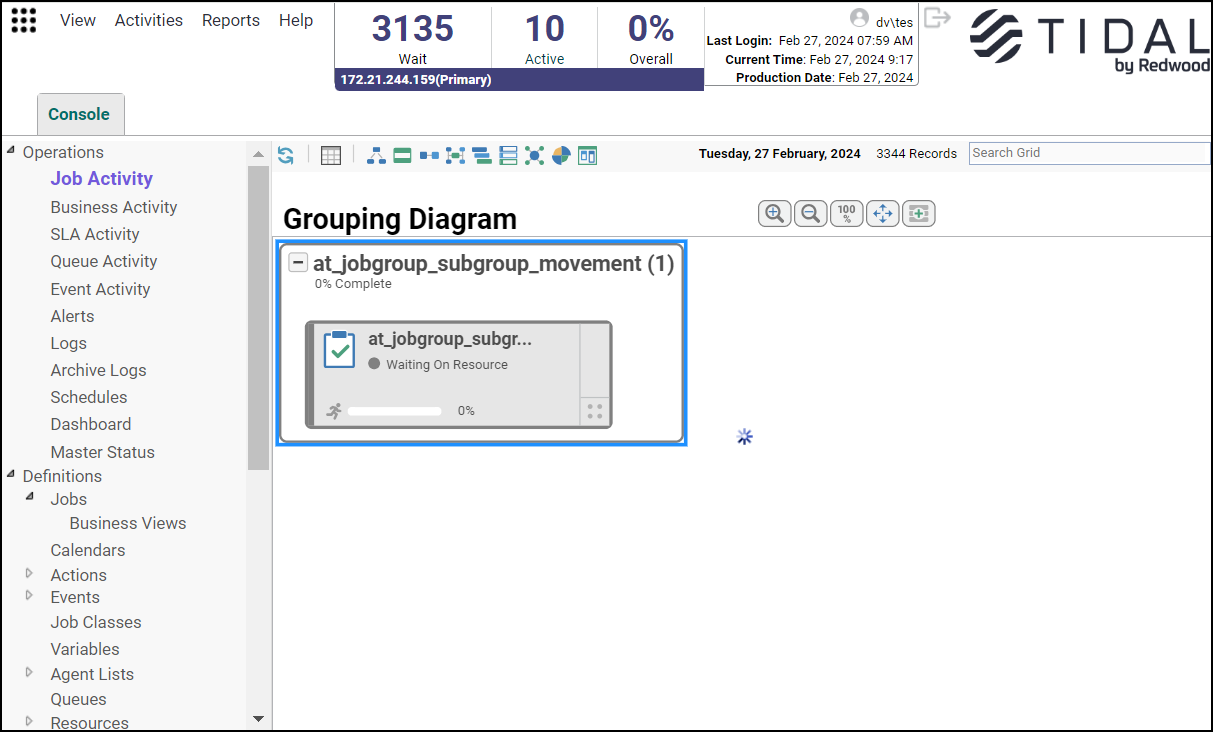
To create a Grouping Diagram:
-
Click one or more job groups on the Job Activity pane.
-
Click the Grouping Diagram icon in the main menu.
-
Select Expand (+) on a group node to show its child nodes. Select Collapse (-) on a group node to hide its child nodes.
Other actions that can be performed while viewing Grouping Diagram are:
-
Right-click a job or a job group node on the Grouping Diagram and choose:
-
Details to display the Job Details dialog.
-
View Critical Path to display the Critical Path Diagram for the selected job occurrences.
-
View Double Tree Diagram – One Level to display the Double Tree Diagram (One Level) for the selected job occurrence.
-
View Double Tree Diagram – All Levels to display the Double Tree Diagram (All Levels) for the selected job occurrences.
-
View Gantt Chart to display the Gantt Chart for the selected job group occurrences.
-
View Status Board to display the Status Board for the selected job group occurrences.
-
View Grouping Diagram to display the Grouping Diagram for the selected job group occurrences.
-
View In Radial Tree to display the Radial Tree Diagram for the selected job or job group occurrences.
-
View In Radial Graph to display the Radial Graph Diagram for the selected job or job group occurrences.
-
Remove From Diagram to remove the selected node from Grouping Diagram view. To show the node again, go to the grid view and refresh the grid.
-
Add Predecessors option to view its preceding node.
-
Add Successors option to view its succeeding node.
-
Insert Job into Schedule to insert an unscheduled job into the schedule. This option is only applicable if the job or job group’s definition has the Unscheduled Allowed option set.
-
Remove Job(s) from Schedule to remove selected job occurrence from the schedule, for any date. If a job group occurrence is selected, all of the group’s child jobs are removed.
-
Add Job Group Children option to add child jobs that are part of the selected job group in the view.
-
-
Right-click anywhere on the Grouping Diagram and select one of these options from the context menu:
-
Add JobRun – Displays the Job Search dialog used to search and add resulting jobrun(s) to the Grouping Diagram.
-
To search for a jobrun you want to add to the Grouping Diagram, specify a value in one or more of these fields and click Search.
-
Job No. – The job number.
-
Name – The job name.
-
Owner – The owner for the job instance.
-
Runtime User – The runtime user for the job instance.
-
Agent – The agent/adapter associated with the job.
-
Type – Whether it is a job or job group.
-
Status – Whether the job is enabled or disabled. Click Show Advanced to display these fields:
Command – The command specified in the job definition.
Agent List – The agent list associated with the job.
Parent Group – The parent job group for the job.
Class – The job class.
Operator Release – Whether the operator release is required or not required.
Unscheduled – Whether the unscheduled job is allowed or not allowed.
The Search Results section lists the job instance records resulting from the search.
Select one or more records and click Add. The selected jobruns are added to the Grouping Diagram.
-
Statistics – Displays the Job Statistics dialog that shows statistics for job occurrences for the day currently displayed in the Job Activity pane. You can view statistics for All Jobs, Production jobs, and Unscheduled jobs on the respective tab. For more information about Job Statistics, see Job Statistics Dialog.
-
Print – Prints the Grouping Diagram.
-
Refresh – Refreshes the Grouping Diagram.